We’re making it easier than ever to understand where your money goes with the new Spending Breakdown feature. This update replaces the Budget tab, offering a clearer, more intuitive way to track your spending across all linked (or manually entered) transactions.
What's New?
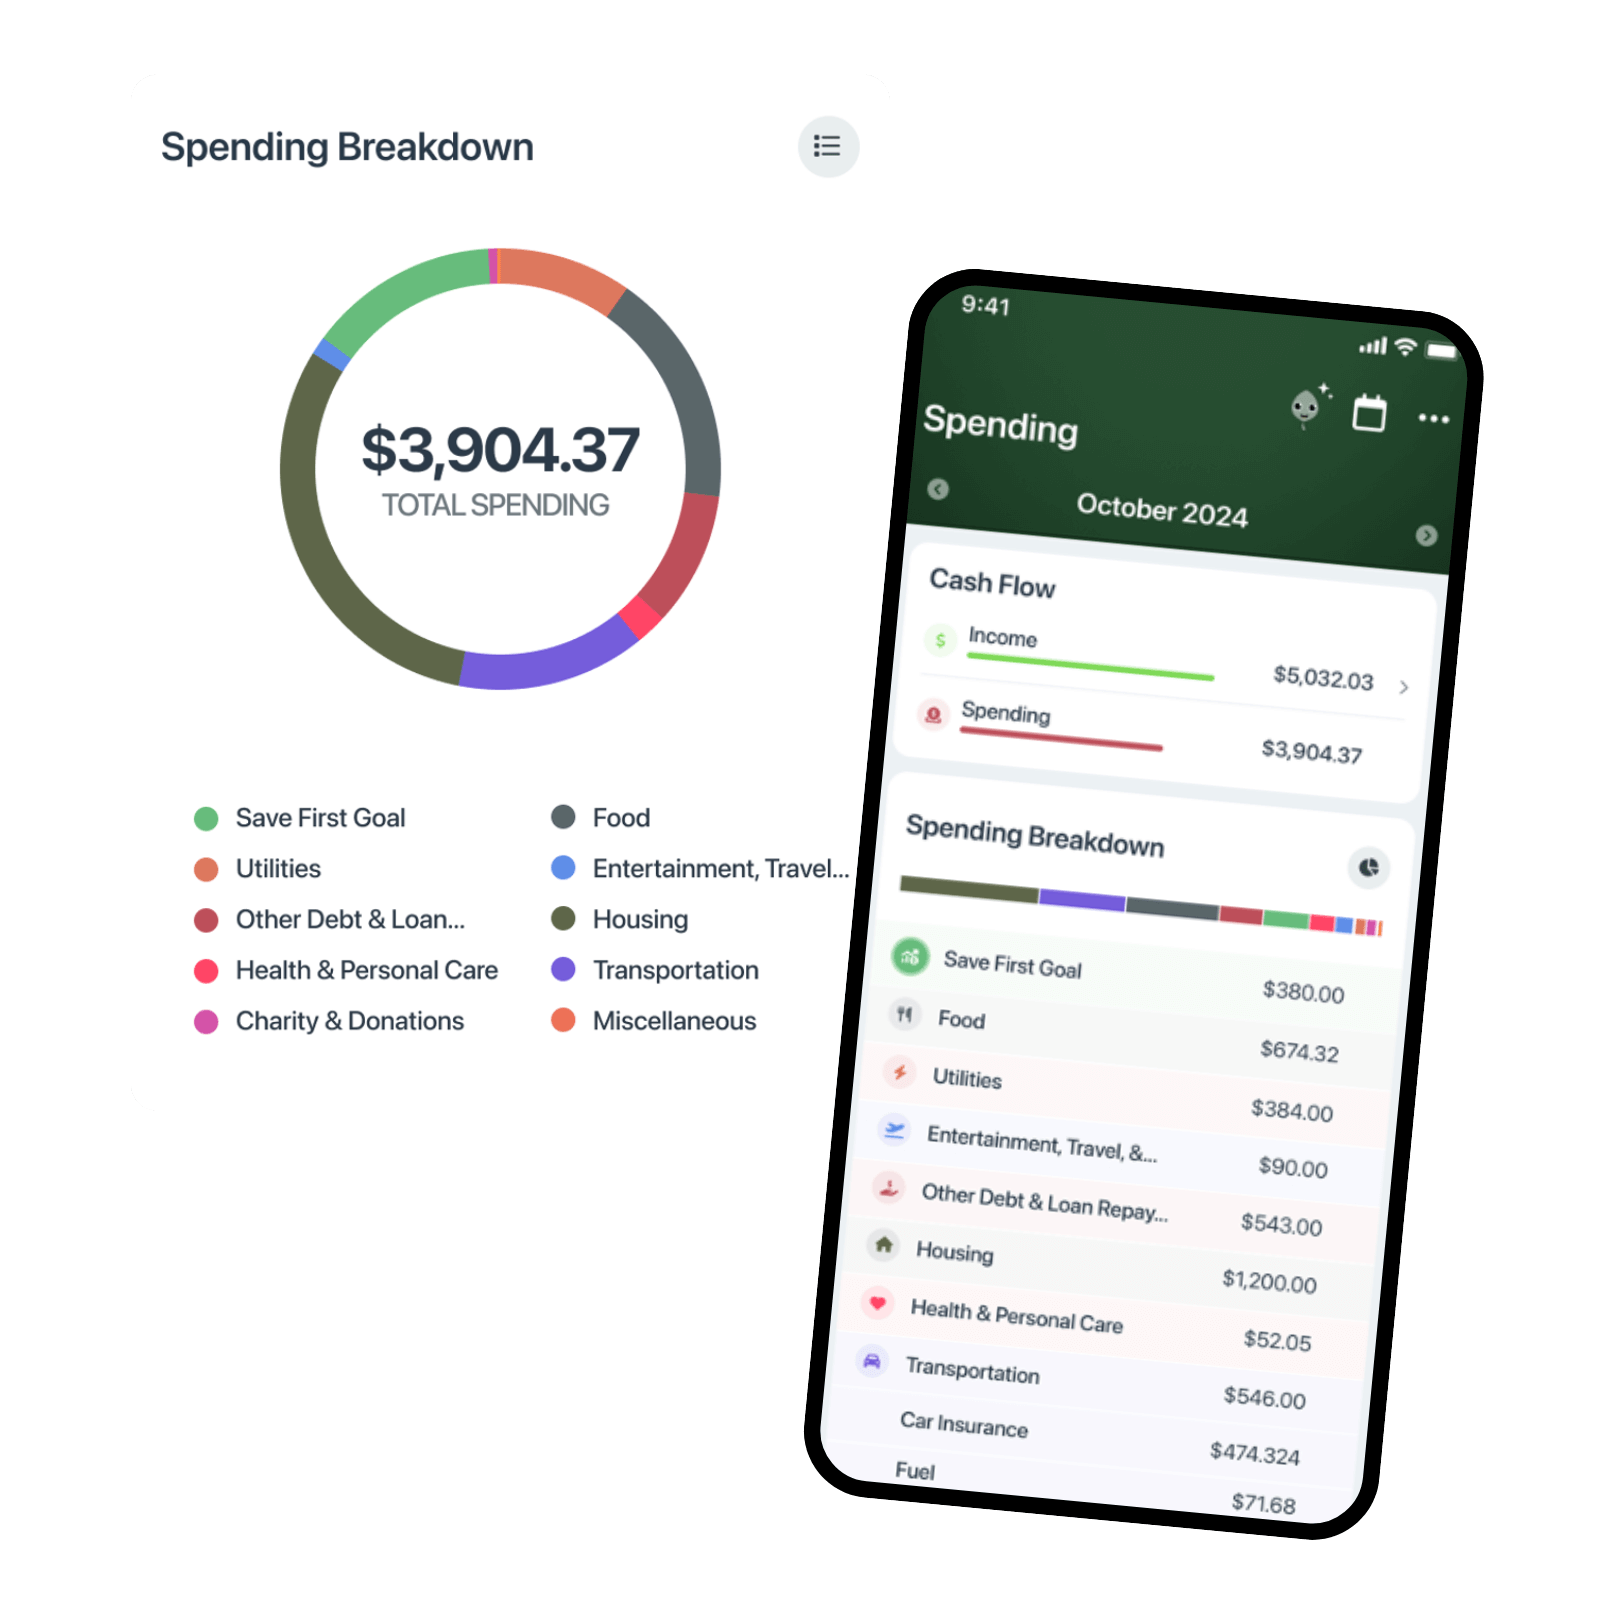
💰 Cash Flow at a Glance – See your total income and spending for the month in one place.
📊 Spending Breakdown – View a categorized list of your spending with an easy-to-read bar chart, prioritizing your highest spending categories.
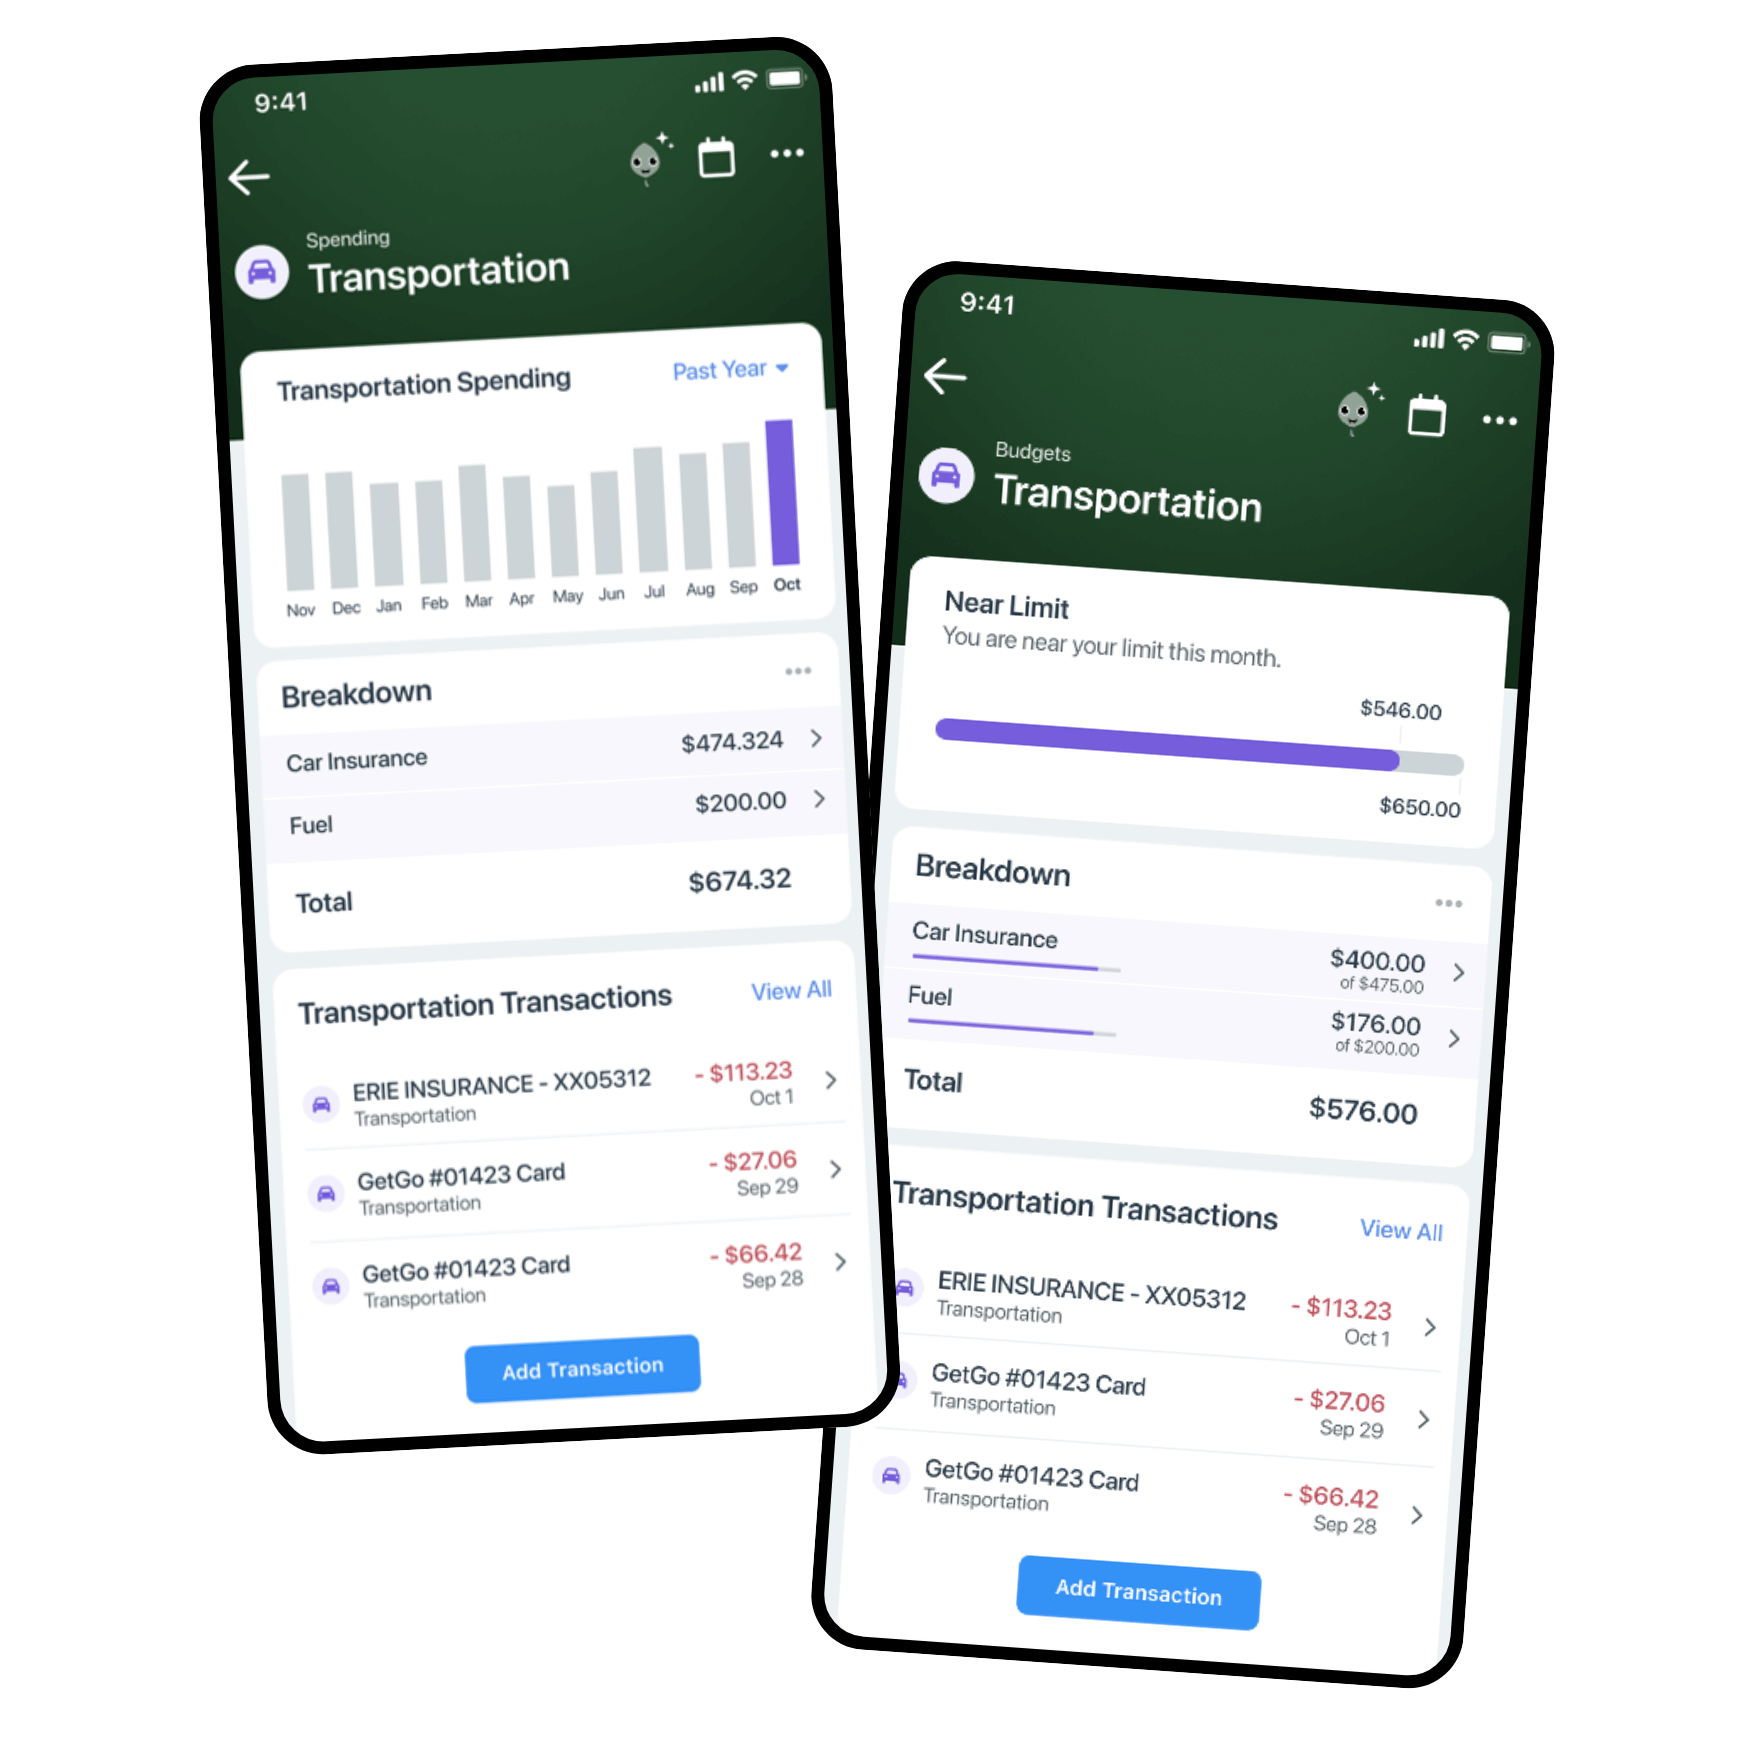
🔍 Detailed Category Insights – Tap into any spending category (e.g., Food, Housing, Transportation) to explore trends over the past year.
📅 Custom Time Periods – Filter your spending by month or a custom date range to see how your habits change over time.
✍️ Manual Entry Support – Need to add a cash purchase or missing transaction? You can do that too!
Change Log
New:
- Replaced Budget tab with Spending
- Automatic categorization of ALL transactions (not just for budgeted categories) from linked accounts
- Interactive spending graphs for category trends – how much did you spend on groceries this month vs last?
Improved:
- Steamlined UI/UX for better navigation and clarity
How to Use Spending Breakdown
1️⃣ Go to the Spending Tab
2️⃣ Explore Your Cash Flow – Instantly see your income vs. spending for the current month. Knowing what you have coming in vs going out is an important first step for new budgeters!
3️⃣ Analyze Your Spending – View your spending by category and tap on any to dive deeper.
4️⃣ Identify Trends – View your past, present and future spending using the built-in timeline feature, or navigate month by month using the quick arrows.