Why Troutwood Is a modern alternative to Finviz Heatmap

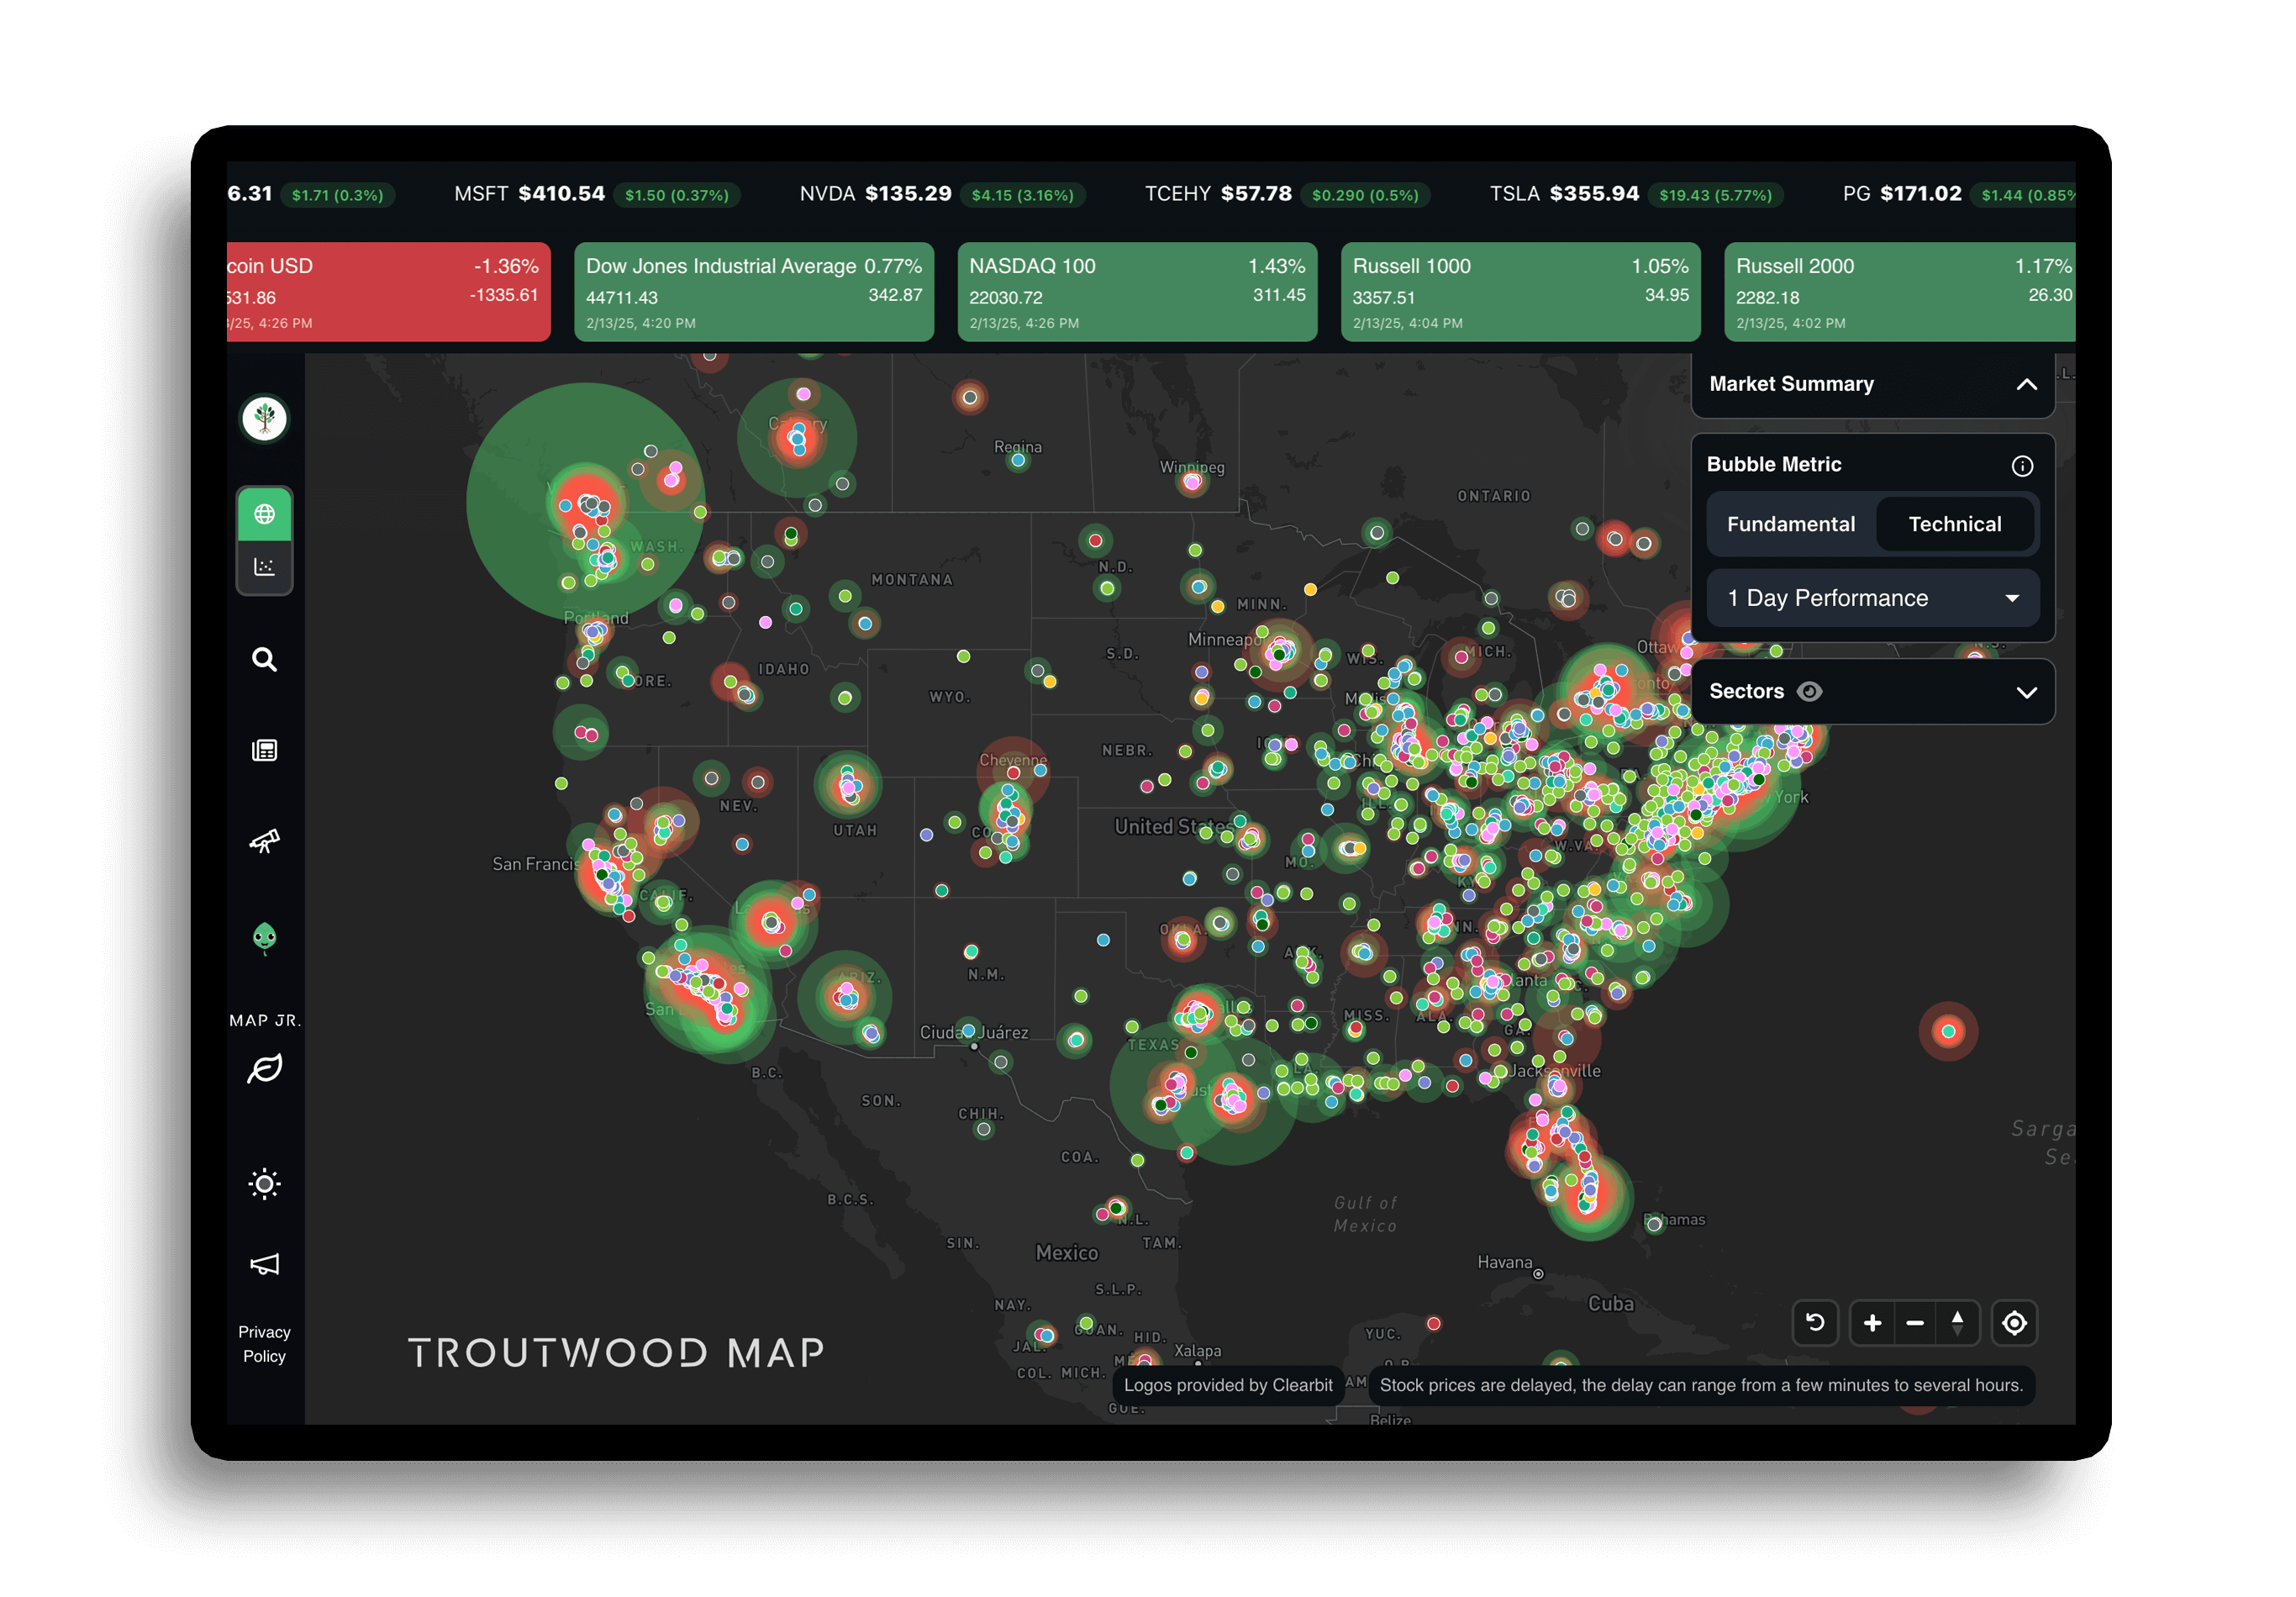
Instead of viewing markets in abstract grids, Troutwood Maps lets you explore the stock market map on an interactive world map. With geography-based insights, it's easier to see where markets are moving and understand the bigger picture behind the numbers. Markets don't move in grids. They move across the world.

Discover

Track trends across the S&P 500, NASDAQ, and global indices.
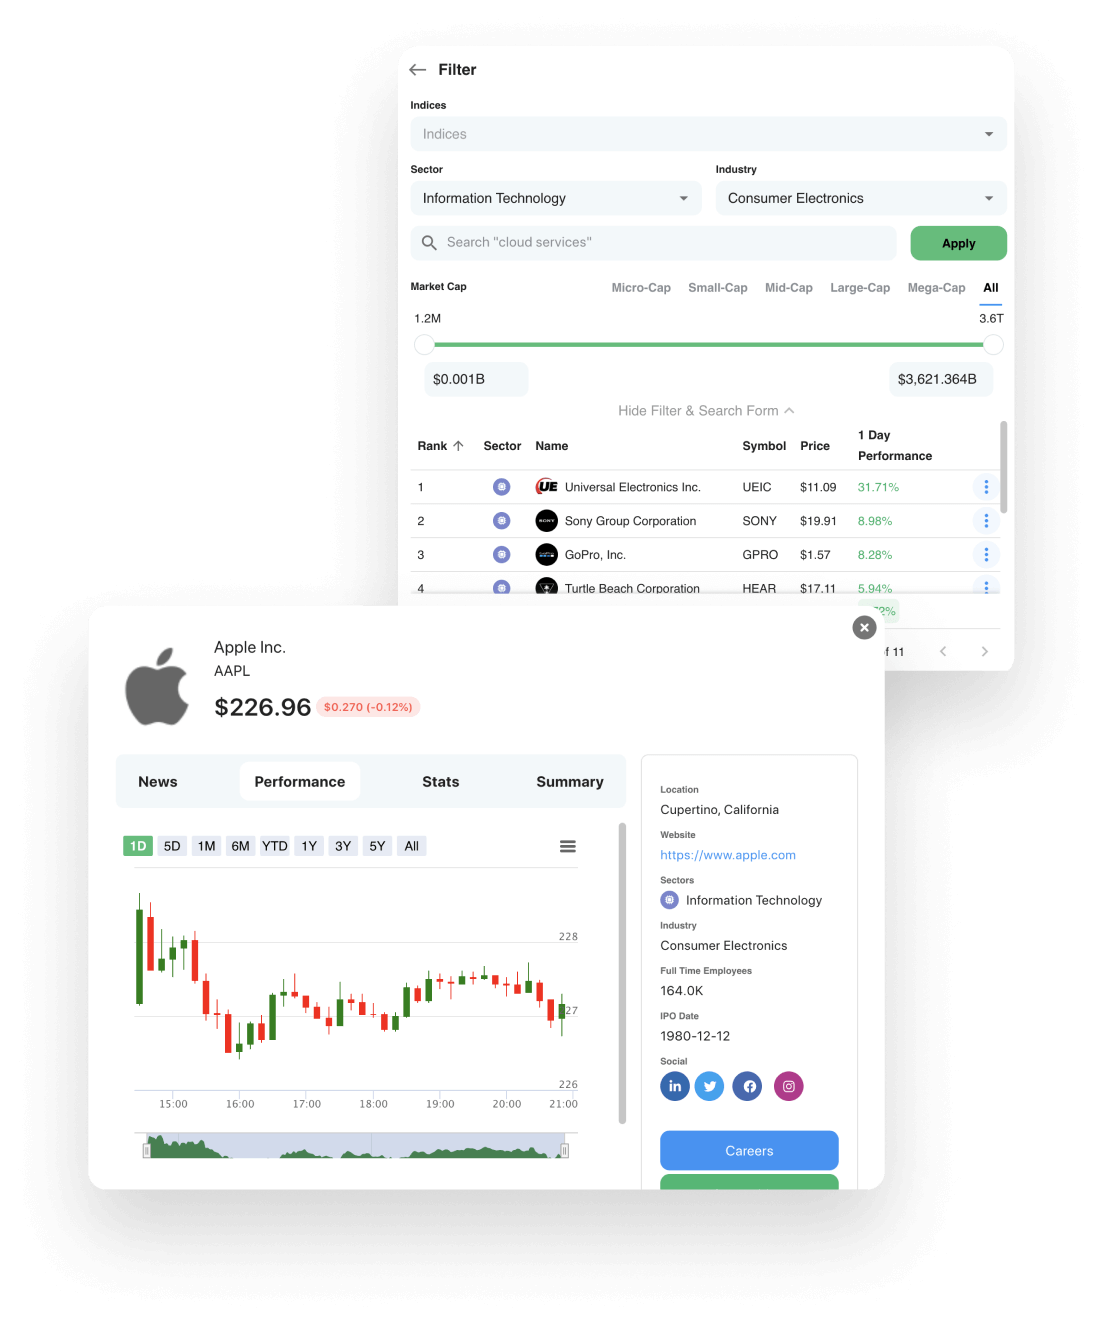
Filter

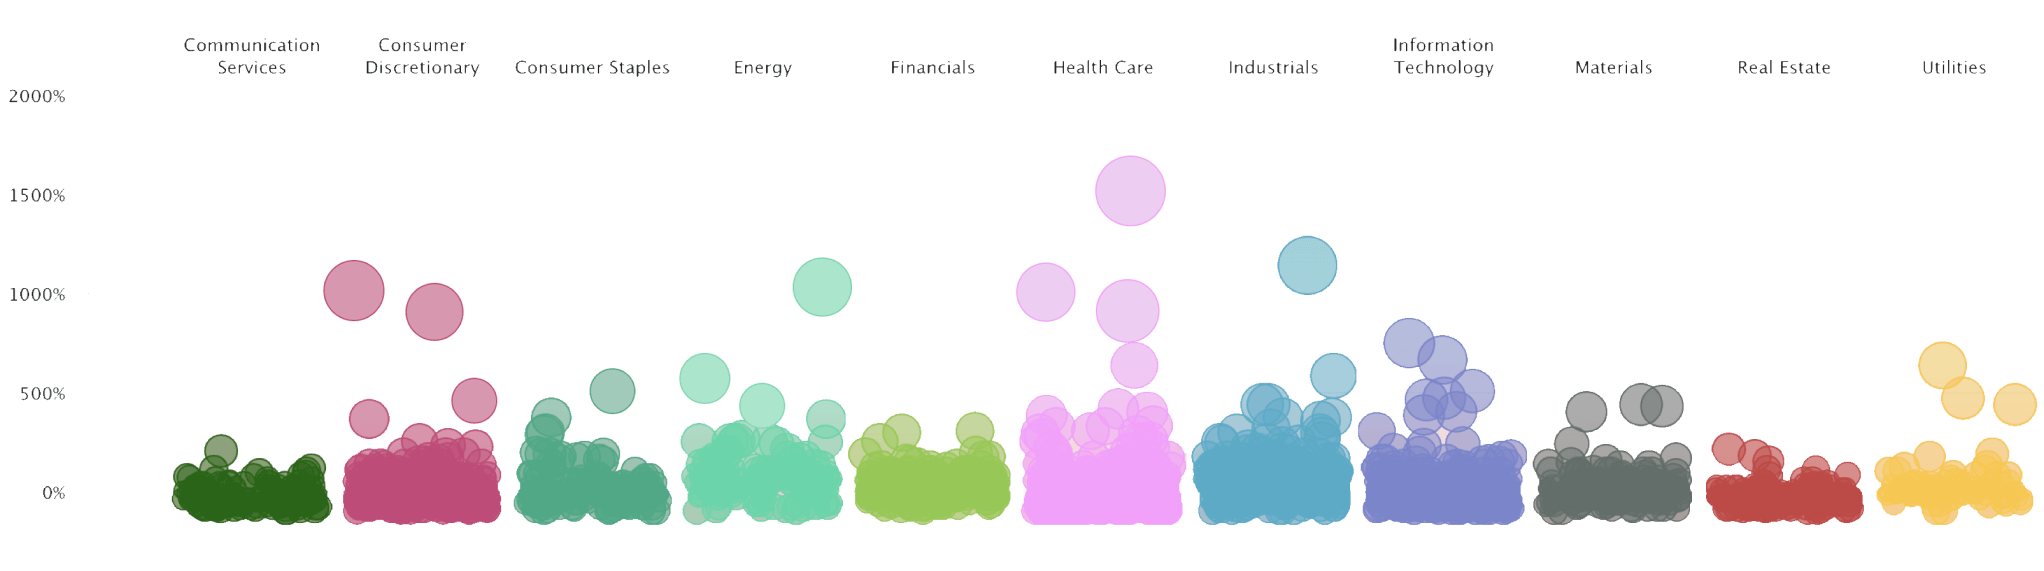
Slice by index, sector, fundamentals, technicals, and more.

Visualize

See market performance on a geographic world map — not a grid.

Discover Market Trends

Learn about global markets, major indexes, and individual companies.

See how individual stocks are performing in real time, explore sector-level movement, and stay informed with relevant financial news coverage. Whether you want a high-level view of the global economy or a deep dive into specific companies, Troutwood helps you understand what’s driving the markets.

Track Trends Across the S&P 500, NASDAQ, and Global Indices

Analyze performance across major U.S. and international indexes to spot rotations and momentum.

Filter Stocks by Index, Sector, and Metrics

Select the S&P 500 heatmap, choose another index, or explore publicly traded companies around the world using advanced filters.

Use powerful filtering tools to search by:

  • Stock market index
  • Stock market sector
  • Fundamental analysis metrics
  • Technical analysis indicators
  • Performance history
  • Individual companies
  • And more

View Company, Sector, and Industry Performance Instantly

Quickly compare stocks, sectors, and industries to see what’s leading, lagging, or breaking out across global markets.

Visualize Market Performance

Explore the stock market with customizable bubble metrics that highlight fundamental and technical characteristics of publicly traded companies. Customize your experience with sector selection, index ranking, and hover-based insights to surface the data that matters most to you.

A Geographic Stock Market Visualization — Not a Grid

Unlike traditional heatmaps, Troutwood visualizes market data on an actual world map, giving you a geographic perspective on stock performance that’s intuitive, engaging, and easy to understand.